Sale!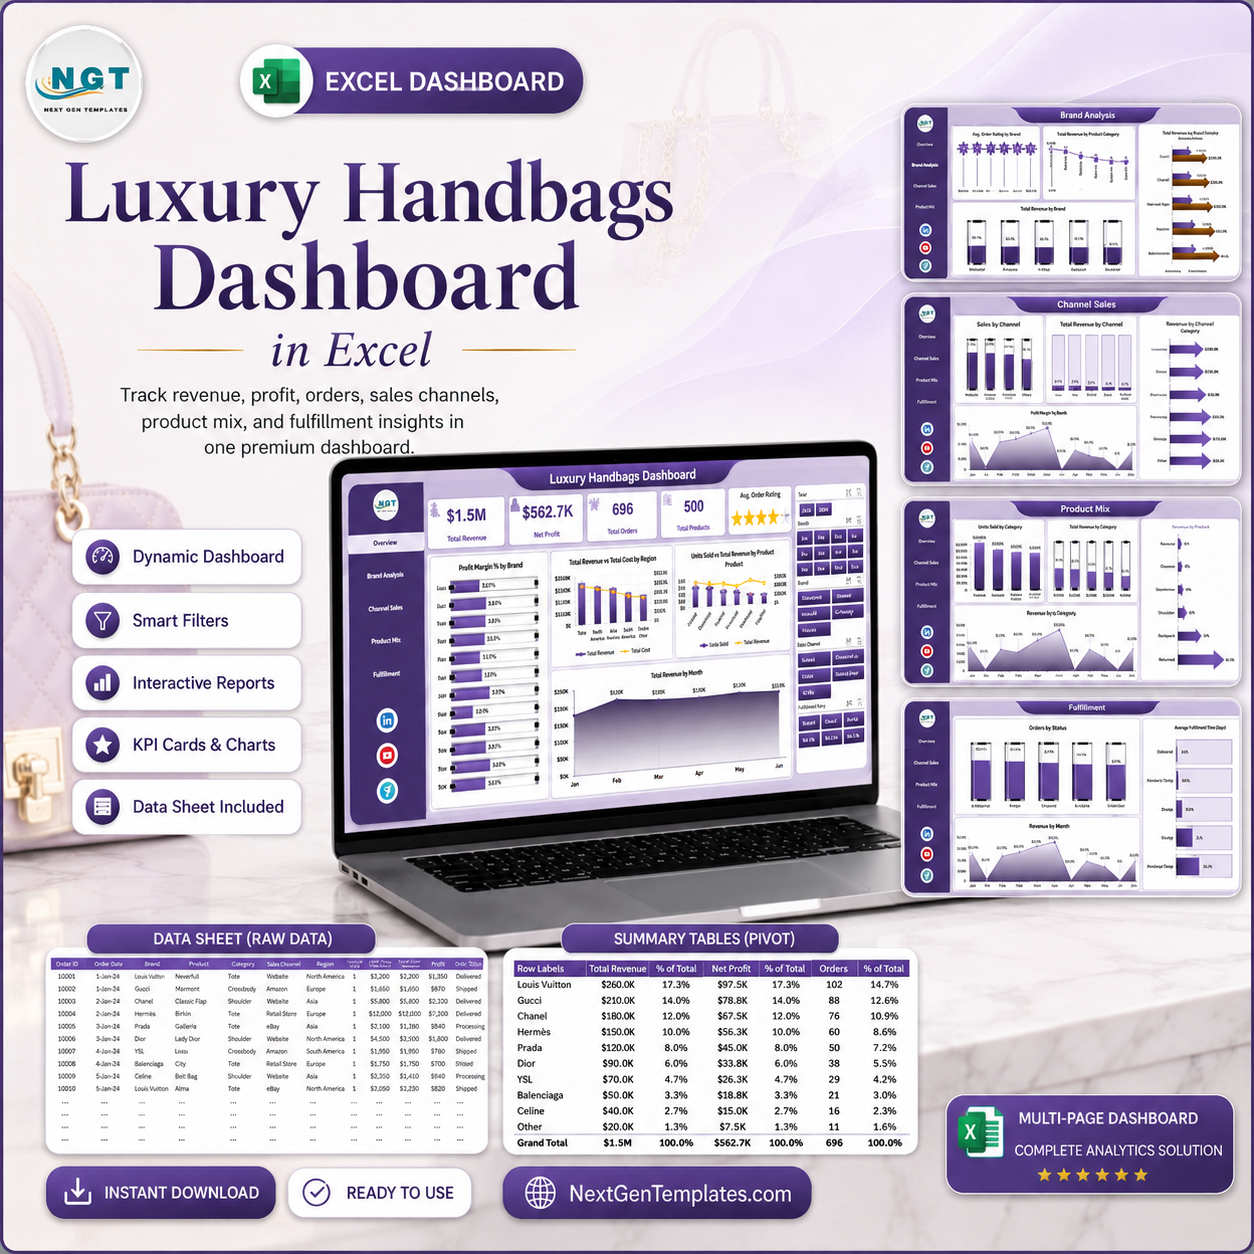
Luxury Handbags Dashboard in Excel
$ 16.19
Luxury Handbags Dashboard in Excel helps premium retail teams turn handbag sales, cost, returns, orders, quality ratings, brands, channels, regions, and product mix data into a clear management dashboard. Luxury retail margins can shift quickly when return rate, material cost, channel performance, or regional demand changes. This editable Excel workbook reduces manual reporting work and gives owners, merchandisers, finance teams, and analysts a practical reporting layer with 5 analysis pages, KPI cards, slicers, a Data Sheet, and a Support Sheet. Your purchase includes a ready-to-use Excel dashboard file backed by a simple 7-day refund/risk-reversal policy if the file does not match the described template. Key Features of Luxury Handbags Dashboard in Excel 5 dashboard pages: Overview, Brand Analysis, Channel Sales, Product Mix, and Fulfillment. 5 KPI cards: Total Revenue, Net Profit, Units Sold, Total Orders, and Avg. Quality Rating. Interactive slicers: Filter the dashboard quickly by available fields and review selected performance. Brand and channel analysis: Compare revenue, cost, rating, margin, and customer segment performance. Product mix reporting: Review material, brand, status, and product category performance. Fulfillment view: Track delivery percentage, returns by month, and returns by sales channel. Refreshable Excel design: Update the Data Sheet, click Refresh All, and refresh the pivot-driven visuals. Editable workbook: Adjust charts, slicers, pivot tables, colors, headings, and source data fields in Excel. Luxury Handbags Dashboard in Excel What’s Inside the Luxury Handbags Dashboard in Excel Overview Page The Overview page gives a high-level read of the luxury handbag business. KPI cards show Total Revenue, Net Profit, Units Sold, Total Orders, and Avg. Quality Rating, so leaders can see commercial health before reviewing detailed charts. Profit Margin % by Month: This chart shows how margin changes month by month. It helps identify seasonal cost pressure, discount periods, and months where pricing or product mix needs review. Total Revenue and Total Cost by Region: This chart compares sales value against cost across regions. It helps teams find high-revenue territories that may still need cost control. Units Sold and Total Revenue by Product Category: This chart connects sales volume with revenue by category. It helps identify categories that sell frequently versus categories that create higher value. Total Revenue by Brand: This chart ranks brands by revenue contribution. It helps managers focus merchandising, campaigns, and inventory on the brands driving the most sales. Brand Analysis The Brand Analysis tab is built for brand-level and segment-level review. It helps luxury retail teams understand which brands deliver quality, revenue, cost control, channel performance, and margin. Avg. Quality Rating by Brand: This chart compares perceived product quality across handbag brands. It helps identify brands that need supplier review or stronger quality positioning. Total Revenue by Customer Segment: This chart shows which customer segments contribute the most revenue. It helps marketing teams align offers, campaigns, and VIP strategies with the right buyers. Total Revenue and Total Cost by Sales Channel: This chart compares sales and cost by channel. It helps teams understand whether online, store, marketplace, or wholesale channels are profitable enough. Profit Margin % by Region: This chart reveals regional margin differences. It helps managers find regions where pricing, shipping, returns, or channel mix may be reducing profit. Brand Analysis Channel Sales The Channel Sales page focuses on delivery performance, return behavior, product category revenue, and monthly cost. It is useful for sales channel managers and operations teams that need to balance growth with service quality. Delivery % by Sales Channel: This chart compares delivery success across channels. It helps teams spot channels where fulfillment experience may be hurting customer satisfaction. Return % by Customer Segment: This chart shows which customer groups return products more often. It helps teams investigate sizing, quality, expectation mismatch, or campaign targeting issues. Total Revenue by Product Category: This chart shows which handbag categories create the most revenue. It supports buying, promotion planning, and category-level inventory decisions. Total Cost by Month: This monthly cost trend helps identify cost spikes. It is useful for reviewing supplier cost, shipping cost, campaign cost, or seasonal operating pressure. Channel Sales Product Mix The Product Mix page helps teams analyze profitability by material, brand, order status, and product category. It is especially useful for merchandisers and product managers reviewing assortment decisions. Net Profit by Material: This chart compares profit across materials such as leather, canvas, suede, or other handbag materials. It helps identify materials that support stronger margins. Profit Margin % by Brand: This chart compares brand-level profitability. It helps teams separate high-revenue brands from truly high-margin brands. Total Orders by Status: This chart summarizes orders by status. It helps operations teams track completed, pending, returned, or cancelled order movement. Return % by Product Category: This chart shows return rate by category. It helps identify product groups with fit, quality, expectation, or delivery issues. Product Mix Fulfillment The Fulfillment page focuses on delivery and returns. It helps luxury handbag teams protect customer experience while controlling expensive reverse logistics. Delivery % by Region: This chart compares delivery performance across regions. It helps identify territories where courier, warehouse, or inventory availability may need attention. Total Returns by Month: This chart tracks return volume over time. It helps teams spot return spikes after campaigns, seasonal peaks, or product launches. Return % by Sales Channel: This chart compares return rate across channels. It helps managers investigate whether marketplace, online, store, or wholesale sales create different return behavior. Fulfillment Data Sheet Tab The Data Sheet is the input sheet where you add luxury handbag records in the same format as the sample data. Keep the column structure consistent so the pivots, slicers, cards, and charts continue to refresh correctly. Data Sheet tab Support Sheet Tab The Support Sheet contains the pivot tables used to create the dashboard dynamically. After updating the Data Sheet, go to the Data tab in the Excel Ribbon and click Refresh All. All pivot tables and charts will refresh. You can keep this sheet hidden for daily use. Support Sheet tab Luxury Handbags Dashboard in Excel vs. Google Sheets vs. Paid CRM/SaaS – Where This Fits Feature This Excel dashboard Google Sheets alternative Paid retail SaaS Cost $17.99 one-time sale price Template or custom build cost Monthly or annual subscription Platform Microsoft Excel Google Sheets Vendor-hosted retail system Setup time Replace data and refresh pivots Import and adapt formulas Implementation and onboarding Customizable fields Fully editable workbook Editable sheet Plan dependent Luxury handbag reporting Built around revenue, profit, ratings, brands, channels, product mix, and fulfillment Must be built or adapted Depends on vendor module Who This Template Is For – and Who It’s Not For This template is for boutique owners, luxury handbag retailers, fashion e-commerce sellers, brand managers, merchandisers, sales analysts, finance teams, and consultants who use Excel and want repeatable dashboard reporting. It is not a full POS, inventory system, order management platform, CRM, or live warehouse solution. Teams that need barcode scanning, live stock sync, automated courier booking, payment processing, or customer communication workflows should use this dashboard as a reporting layer after exporting data. How to Use the Luxury Handbags Dashboard in Excel Open the workbook in Microsoft Excel. Go to the Data Sheet and replace the sample records with your own data. Keep the same column structure and field names. Open the Data tab in the Excel Ribbon and click Refresh All. Use slicers to filter dashboard pages by brand, region, channel, category, month, or other available fields. Review the Support Sheet only when you need to inspect pivot tables; it can stay hidden for normal users. Real-World Use Cases Priya, boutique owner: checks Total Revenue, Net Profit, Units Sold, and Return % every week before deciding which handbag categories to promote. Arjun, retail finance analyst: uses the region, channel, material, and brand charts to explain margin movement in monthly business reviews. Sofia, luxury brand manager: compares quality ratings, brand revenue, product returns, and fulfillment performance before supplier and merchandising meetings. Frequently Asked Questions What is included in the Luxury Handbags Dashboard in Excel? You get an editable Excel dashboard workbook with Overview, Brand Analysis, Channel Sales, Product Mix, Fulfillment, Data Sheet, and Support Sheet tabs. How do I update the dashboard? Add or paste your records into the Data Sheet in the same format, then click Refresh All from the Excel Data tab. Can I customize the workbook? Yes. You can edit charts, pivot tables, formulas, slicers, labels, colors, and sheet names directly in Excel. Does this dashboard work without macros? The dashboard is designed around Excel data, pivots, charts, and slicers. If your purchased file includes any extra automation, review the workbook notes before changing security settings. Is this suitable for small boutiques? Yes. A single boutique can use the template with sample-style sales data, and larger teams can extend the workbook for additional brands, regions, and channels. Does this replace retail software? No. It is a reporting dashboard, not a POS, CRM, warehouse, or order management system. About the Author Built by PK – Microsoft Certified Professional with 15 years of Excel, Google Sheets, and Power BI experience. Founder of NextGenTemplates, reaching 300K subscribers across YouTube channels. Every template is hand-built and tested before release. Explore Related Templates Luxury Handbags KPI Dashboard in Excel Fashion Boutiques Dashboard in Excel Fashion E-commerce Dashboard in Excel Baby Products Retail Dashboard in Excel Browse more Excel dashboard templates Download the Luxury Handbags Dashboard in Excel today and start reviewing brand, channel, product mix, margin, return, and fulfillment performance in one workbook. Watch the step-by-step video tutorial:
Related products
-
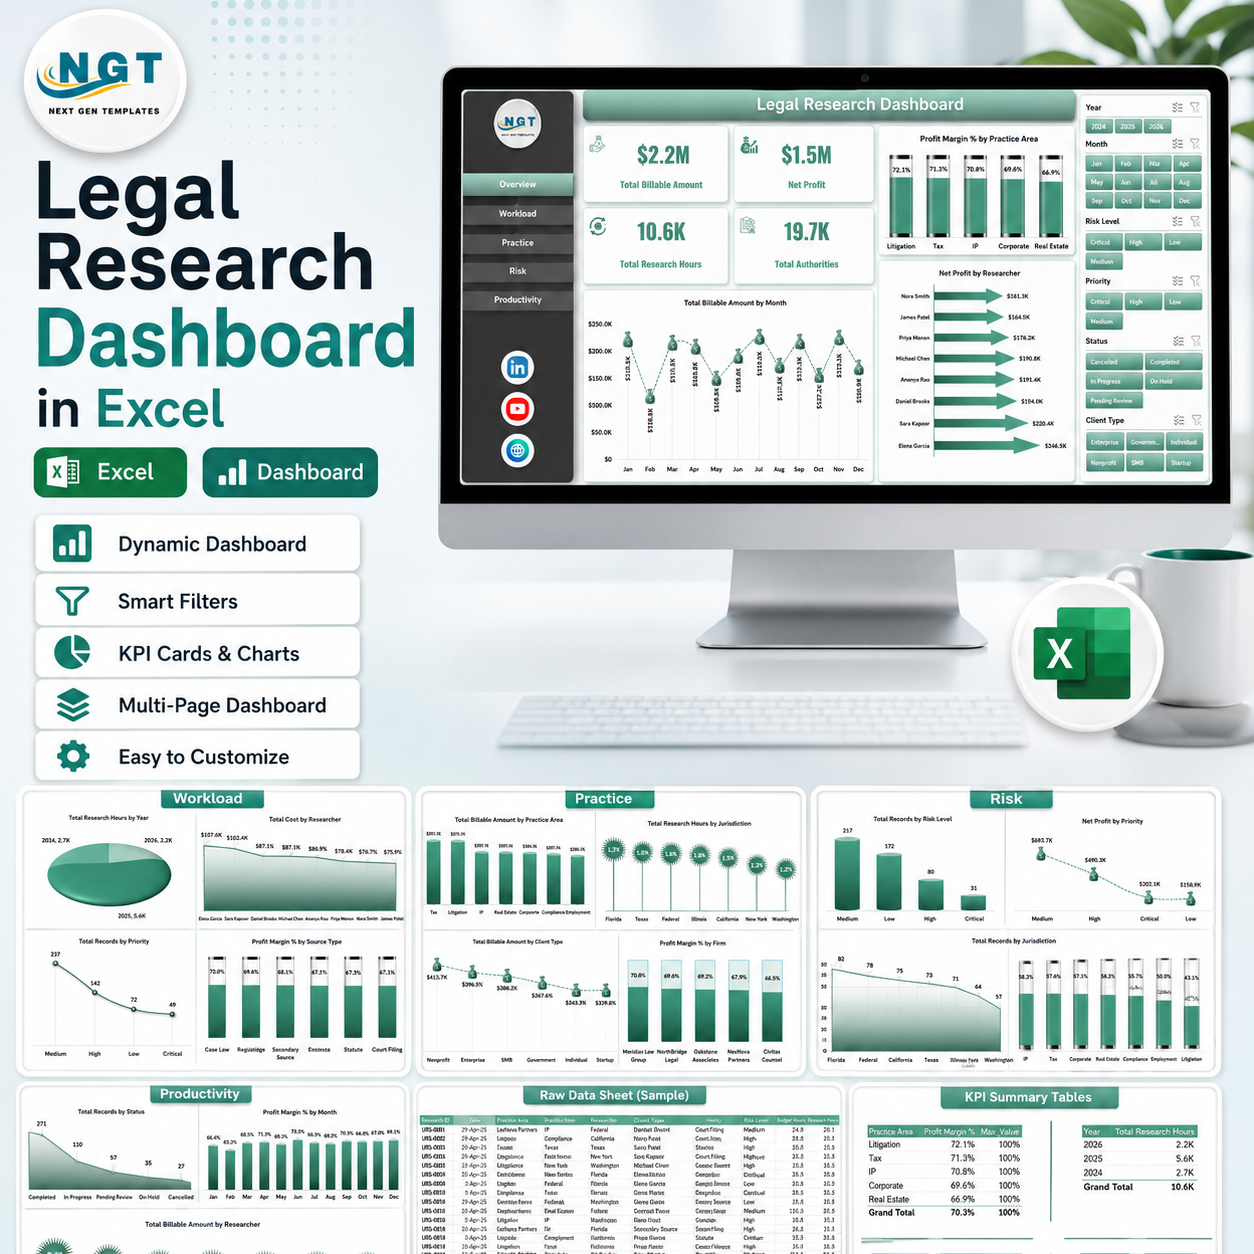 Legal Research Dashboard in ExcelSelect options This product has multiple variants. The options may be chosen on the product page
 -
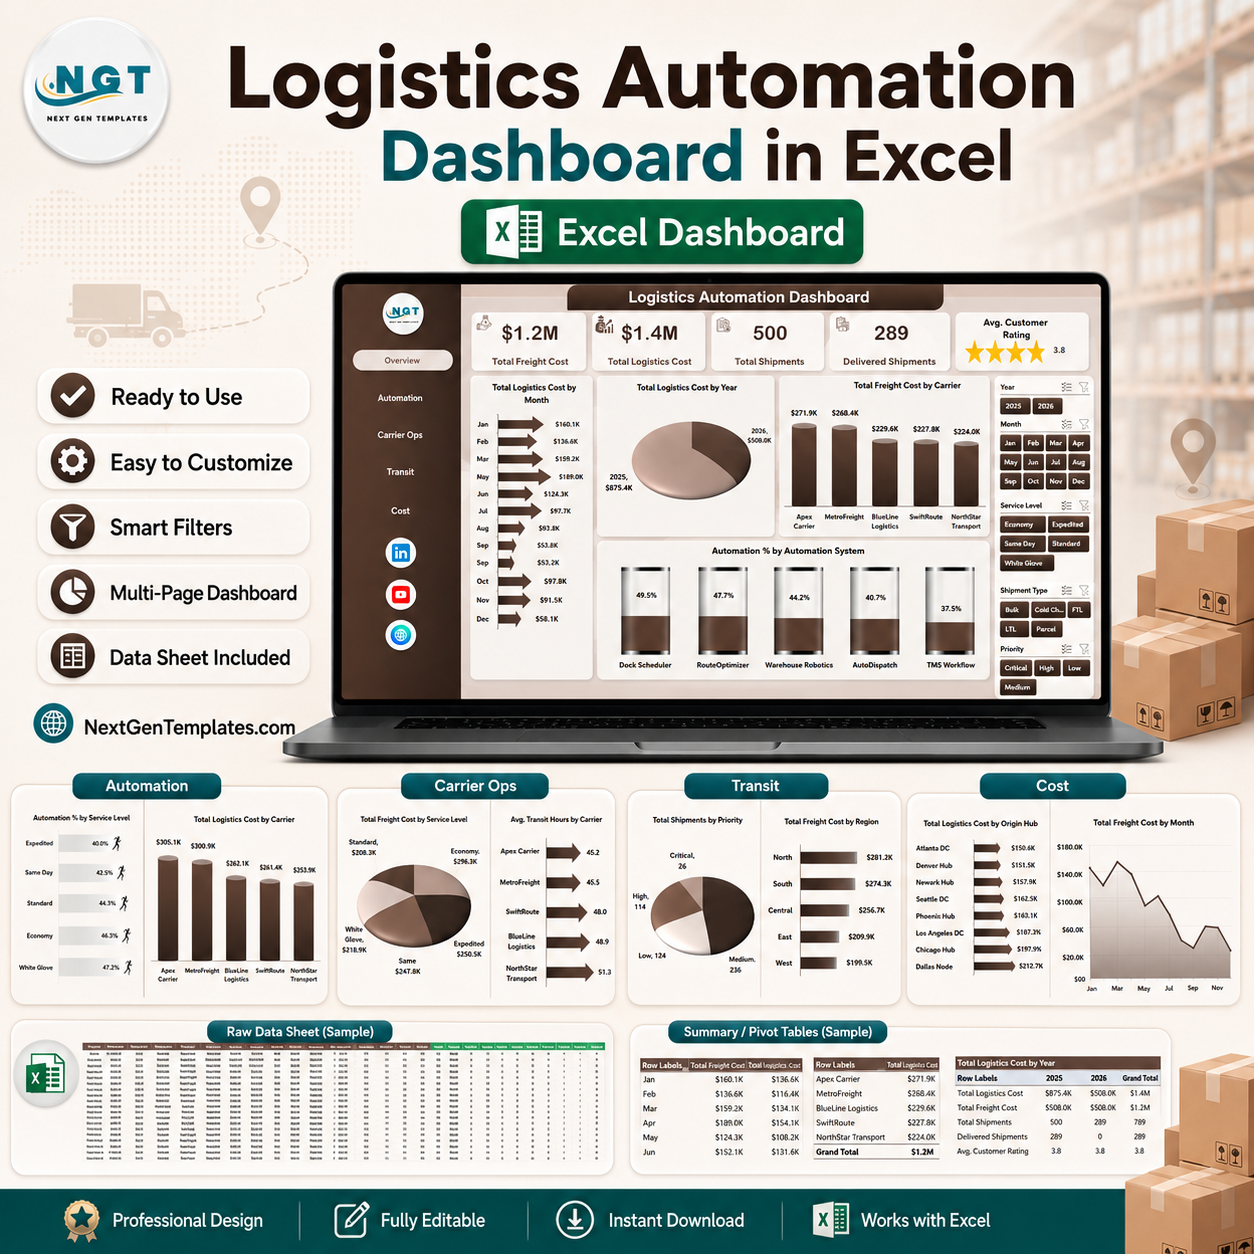 Logistics Automation Dashboard in ExcelSelect options This product has multiple variants. The options may be chosen on the product page
 -
 Knowledge Hubs Dashboard in ExcelAdd to cart