Sale!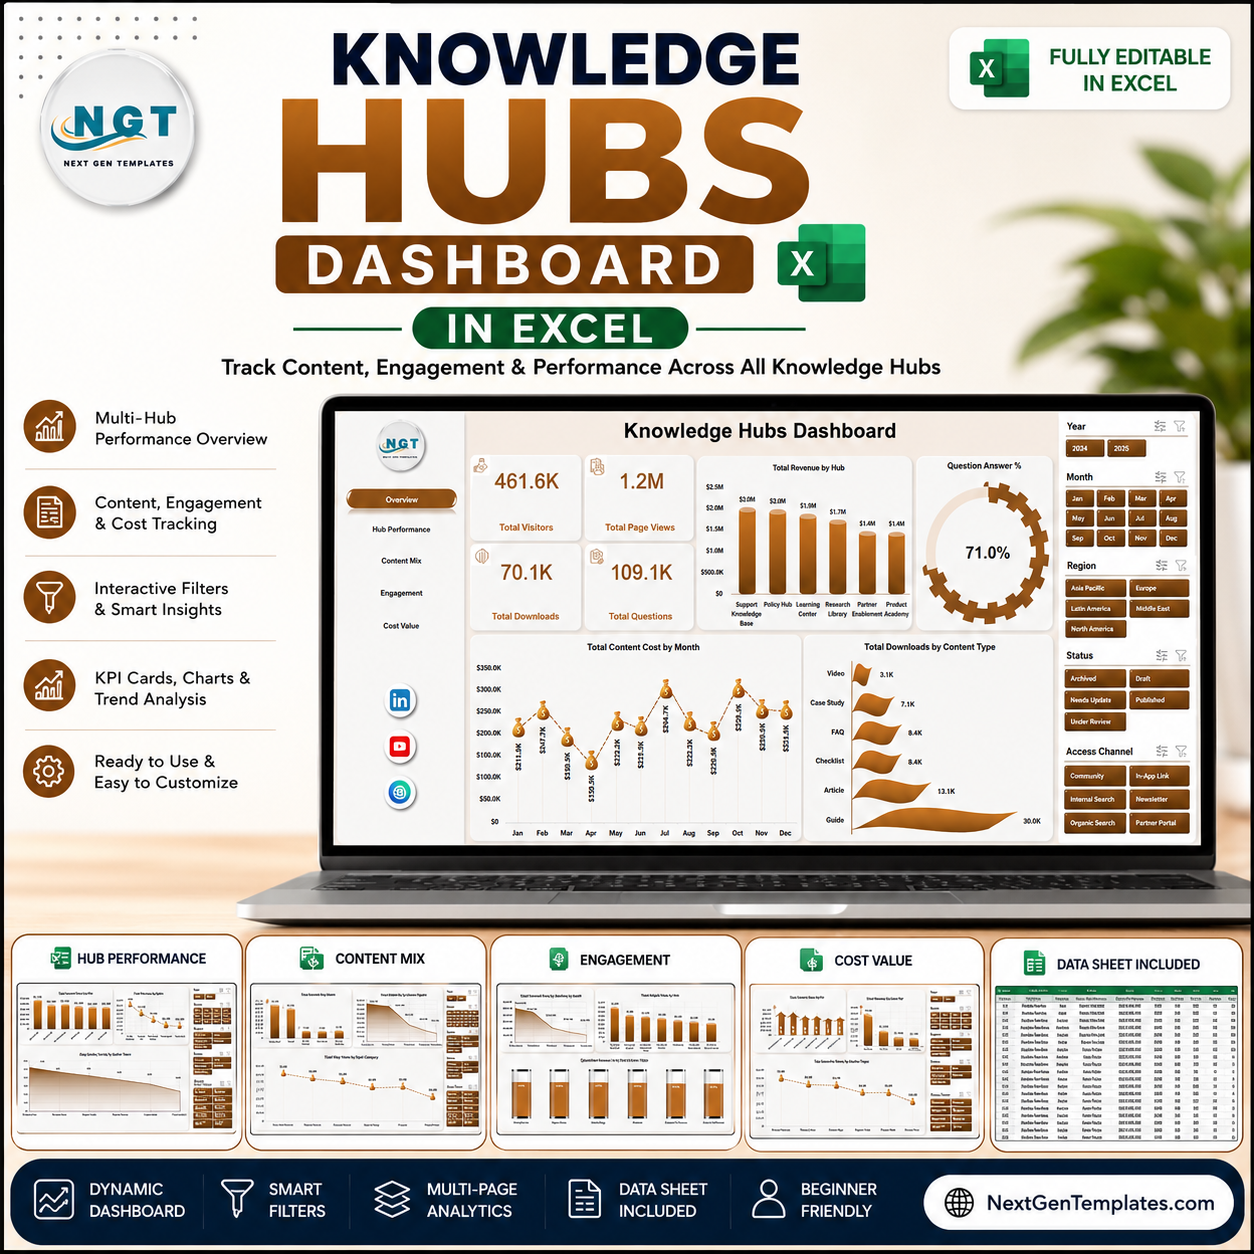
Knowledge Hubs Dashboard in Excel
$ 16.98
Knowledge Hubs Dashboard in Excel helps knowledge managers, content operations teams, training teams, and support leaders review visitors, page views, downloads, questions, revenue, content cost, quality ratings, helpful votes, and net content value in one workbook. Research from knowledge management and customer support teams often points to the same issue: content exists, but performance signals are scattered across platforms, spreadsheets, and exports. This Excel dashboard gives you a practical one-time reporting file with sample data, slicers, pivot-driven charts, and a clear workflow: replace the sample rows, refresh the workbook, and review the updated dashboard before making content decisions. Key Features of Knowledge Hubs Dashboard in Excel Seven worksheet tabs covering Overview, Hub Performance, Content Mix, Engagement, Cost Value, Data Sheet, and Support Sheet. High-level cards for Total Visitors, Total Page Views, Total Downloads, and Total Questions. Interactive slicers so users can filter dashboard pages quickly without rebuilding charts. Hub, region, content type, topic category, author team, access channel, status, and audience segment analysis. Cost and value reporting for content cost, revenue, helpful votes, downloads, and net content value. Editable Data Sheet where users can paste new knowledge hub records in the same structure. Support Sheet with pivot tables that refresh all dashboard visuals after the data is updated. Knowledge Hubs Dashboard in Excel What’s Inside the Knowledge Hubs Dashboard in Excel The workbook is built as a multi-page Excel reporting system for knowledge hub performance. The Overview Page shows Total Visitors, Total Page Views, Total Downloads, and Total Questions. It also includes charts for Total Revenue by Hub, Question Answer % by Overall Dashboard, Total Content Cost by Month, and Total Downloads by Content Type. The Hub Performance page compares Total Content Cost by Hub, Total Revenue by Region, Total Content Cost by Content Type, and Avg. Quality Rating by Author Team. The Content Mix page reviews Total Records by Status, Total Visitors by Audience Segment, Total Visitors by Access Channel, and Total Page Views by Topic Category. The Engagement page covers Total Content Cost by Audience Segment, Total Helpful Votes by Hub, Total Revenue by Month, and Question Answer % by Topic Category. The Cost Value page focuses on Net Content Value by Hub, Total Revenue by Content Type, Total Records by Month, and Net Content Value by Author Team. Hub Performance Content Mix Engagement Cost Value Knowledge Hubs Dashboard in Excel vs. Google Sheets vs. Paid CRM/SaaS – Where This Fits Area This Excel Dashboard Google Sheets Alternative Paid SaaS Alternative Cost One-time Excel template purchase Low cost, but may need manual build Monthly subscription for knowledge base, BI, or support tools Setup time Replace sample records and refresh pivots Requires chart and formula setup Usually needs onboarding and configuration Platform Microsoft Excel Browser-based Google Sheets Vendor platform such as Confluence, Notion, Zendesk, or BI SaaS Customization Editable sheets, pivots, slicers, and charts Flexible but lighter pivot/chart workflow Often limited by plan and admin settings Best use Monthly knowledge hub reporting and content performance review Shared lightweight tracking Live workflow, publishing, permissions, and enterprise support Who This Template Is For – and Who It’s Not For This template is useful for knowledge managers, content operations analysts, help center owners, enablement teams, learning teams, community managers, and operations leaders who need a practical reporting workbook for knowledge hub performance. It is especially helpful when data is exported from different systems and reviewed monthly in Excel. It is not a knowledge base authoring platform, ticketing system, LMS, CMS, CRM, or real-time content analytics platform. It does not publish articles or manage permissions. It is a dashboard workbook for analysis after your source data is prepared. How to Use the Knowledge Hubs Dashboard in Excel Open the workbook in Microsoft Excel. Go to the Data Sheet and replace the sample rows with your own knowledge hub records. Keep the same column structure so slicers, pivots, and charts can read the data correctly. Go to the Data tab in the Excel Ribbon and click Refresh All. Use slicers on each dashboard page to filter by hub, month, content type, region, topic category, author team, status, audience segment, or channel. Review Overview, Hub Performance, Content Mix, Engagement, and Cost Value before sharing the workbook. Data Sheet tab Support sheet tab Real-World Use Cases Ananya, knowledge manager: reviews the Overview page every month to compare visitors, page views, downloads, questions, and revenue across knowledge hubs. David, content operations lead: uses Content Mix and Engagement to identify which content types, topic categories, and audience segments create the highest interaction. Meera, enablement analyst: uses Cost Value to compare net content value by hub and author team before deciding where to invest the next content sprint. Frequently Asked Questions What does the Knowledge Hubs Dashboard in Excel track? It tracks visitors, page views, downloads, questions, question answer percentage, content cost, revenue, helpful votes, quality rating, records, and net content value across hub and content dimensions. How many worksheet tabs are included? The workbook includes seven tabs: Overview, Hub Performance, Content Mix, Engagement, Cost Value, Data Sheet, and Support Sheet. Do the charts update automatically? The charts are powered by pivot tables. After updating the Data Sheet, click Refresh All from the Excel Data tab to update the dashboard. Can I use my own knowledge hub data? Yes. Replace the sample records in the Data Sheet with your own data while keeping the same column format. Can the Support Sheet be hidden? Yes. The Support Sheet contains the pivot tables used to create the dashboard dynamically, and it can stay hidden during normal use. Is this a live knowledge base platform? No. It is an Excel reporting dashboard, not a live CMS, help desk, or knowledge base platform. About the Author Built by PK – Microsoft Certified Professional with 15 years of Excel, Google Sheets, and Power BI experience. Founder of NextGenTemplates, reaching 300K subscribers across YouTube channels. Every template is hand-built and tested before release. Explore Related Templates You may also like the Knowledge Hubs KPI Dashboard in Excel, Knowledge Hubs KPI Dashboard in Power BI, and IoT Services Dashboard in Excel. Browse more Excel Dashboard templates and MS Excel templates. Download the Knowledge Hubs Dashboard in Excel today and build a cleaner reporting workflow for hub performance, content mix, engagement, cost, and content value. Watch the step-by-step video tutorial:
Related products
-
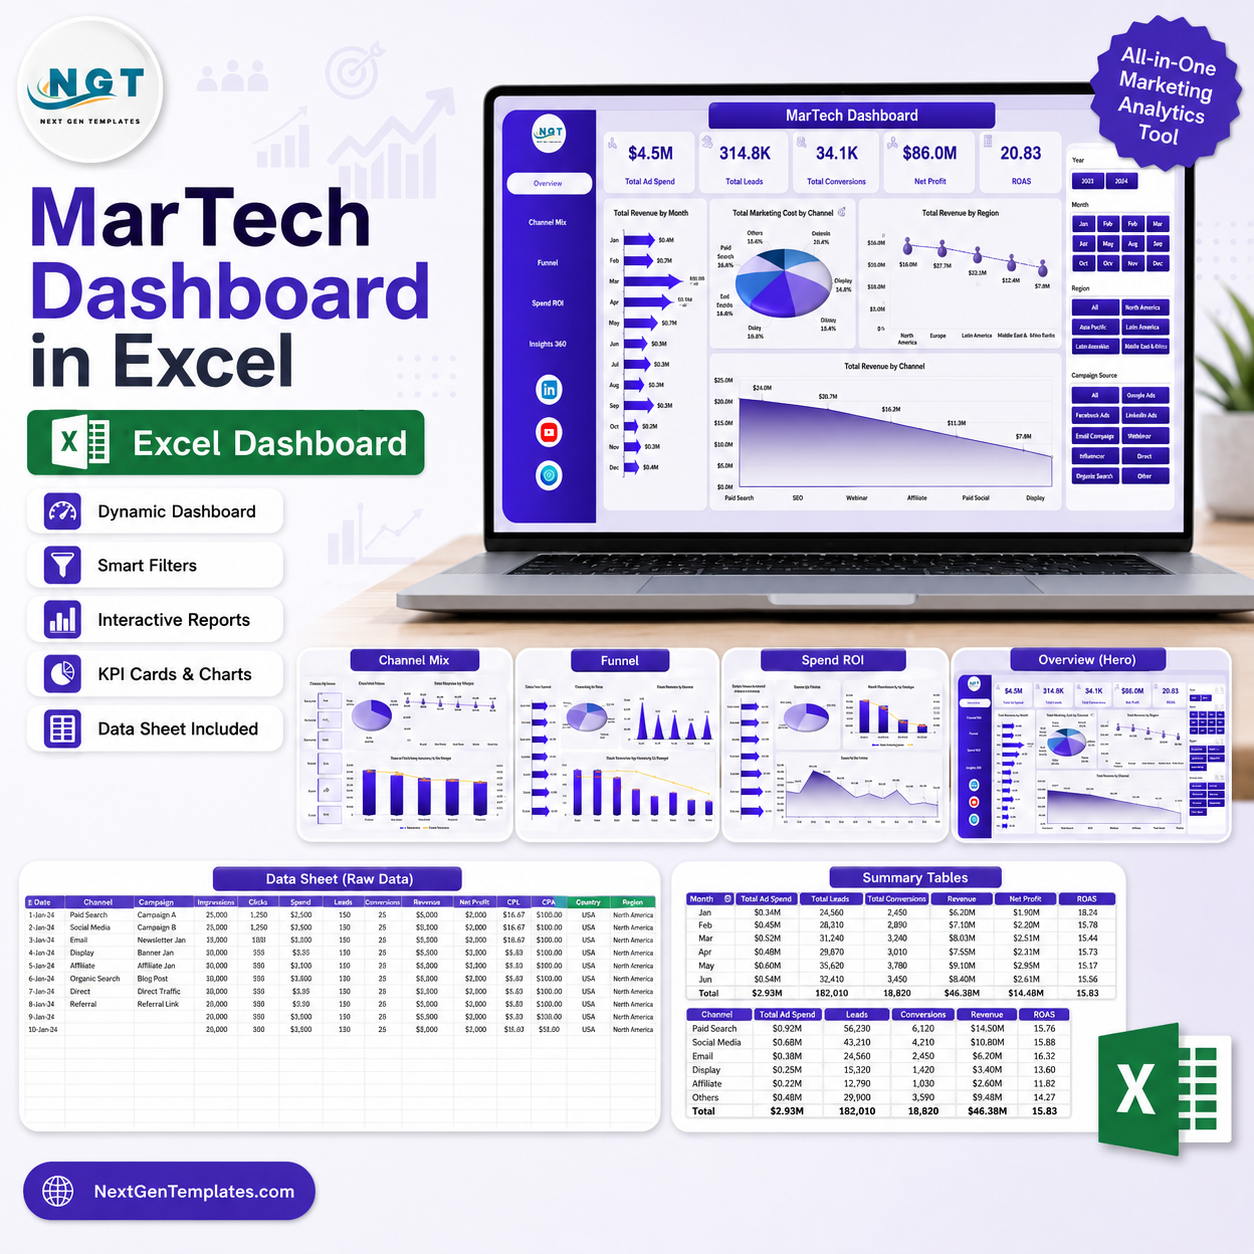 MarTech Dashboard in ExcelSelect options This product has multiple variants. The options may be chosen on the product page
 -
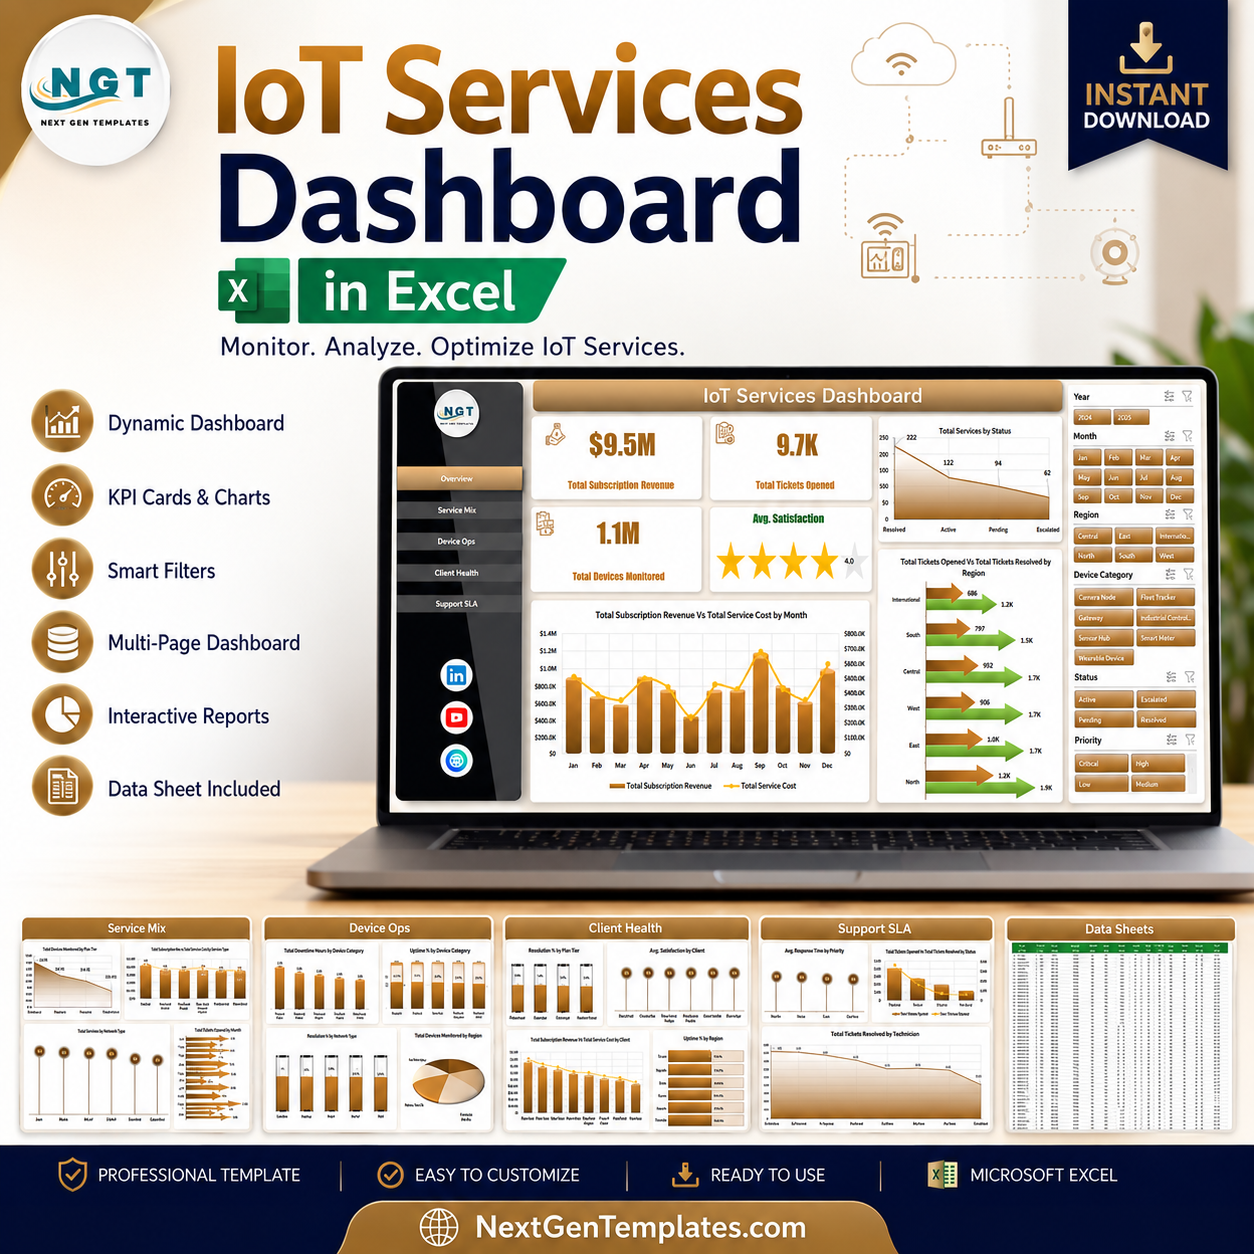 IoT Services Dashboard in ExcelSelect options This product has multiple variants. The options may be chosen on the product page
 -
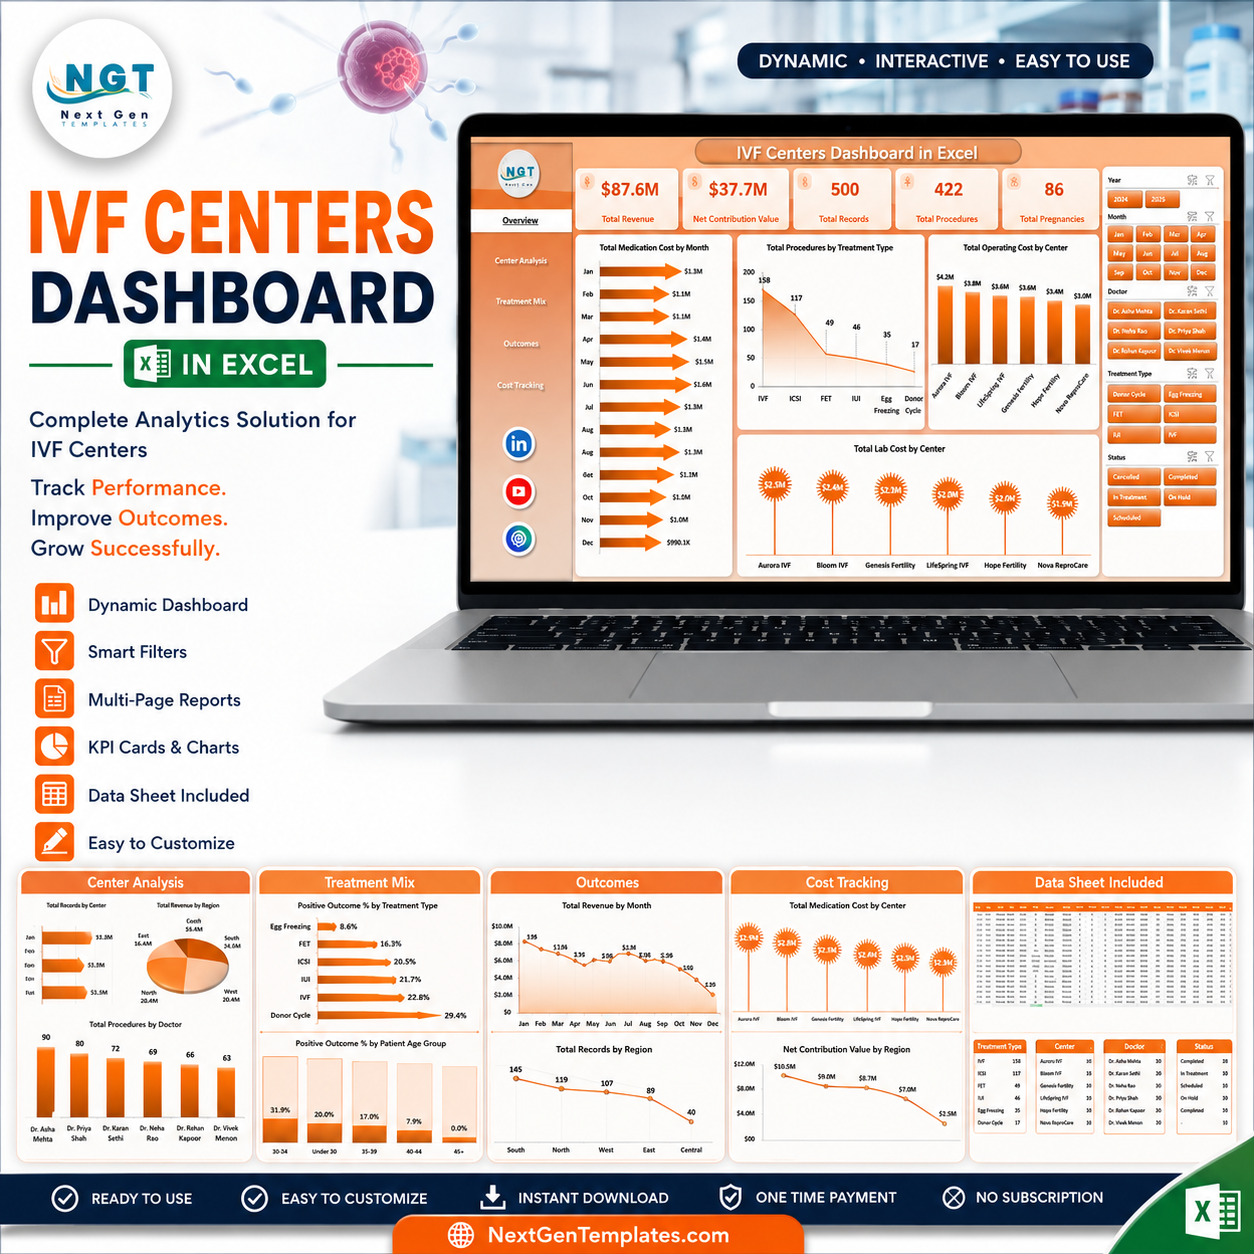 IVF Centers Dashboard in ExcelAdd to cart